
How to Measure Operational Efficiency: A Practical Guide for Banking & Insurance
How to Measure Operational Efficiency: A Practical Guide for Banking & Insurance
Discover how to measure operational efficiency and boost performance in banking and insurance with practical steps, KPIs, and AI-driven insights.

Measuring operational efficiency isn't just about shaving a few points off your expense ratio. It's a much deeper dive into how your core resources—your people, your tech stack, and your time—actually create value for the business and your customers.
This means you have to get granular. You need precise KPIs for the workflows that matter most, whether that's processing insurance claims or handling customer service inquiries in a bank. The goal is to use hard data to find the real bottlenecks and then fix them. For a detailed guide on implementation, exploring how to improve operational efficiency provides a foundational next step.
Rethinking Operational Efficiency in the AI Era
Let's be honest. Staring at dashboards full of stale, traditional metrics just won't cut it anymore. If you're a leader in banking or insurance, you're feeling the pressure from fintech disruptors and sky-high customer expectations. The old ways of measuring operational efficiency are simply not equipped to handle the complexity of modern, digitally-driven workflows.
This is especially true as AI starts to reshape everything.
With the rise of AI customer care and automated claims processing, we need a complete rethink. It’s no longer enough to just track things like average handling time or the number of claims pushed through in a day. Those numbers don't tell you the whole story. They can't explain why a complex claim has been sitting in a queue for a week or pinpoint the exact interaction that’s causing a customer to get frustrated.
The Shift from Cost-Cutting to Value Creation
The conversation has moved on. We're shifting away from a narrow-minded focus on cost reduction toward a much broader view of value creation. This means connecting operational improvements directly to things that really move the needle: customer satisfaction, employee morale, and your competitive standing in the market.
For AI insurance companies, this shift is non-negotiable. They aren't just using technology to do the same old things a bit faster; they're fundamentally changing the service they deliver. A big part of this modern approach involves a smarter strategy for managing technology spend, which makes understanding cloud cost optimization a critical piece of the puzzle.
The real goal of measuring efficiency isn’t just to find savings. It's to pinpoint the exact opportunities where intelligent automation can eliminate friction, boost accuracy, and create a better experience for both your customers and your team.
This guide will walk you through a practical framework designed for this new reality. We’ll look at how modern measurement helps you identify the specific bottlenecks where AI can deliver the biggest wins, turning efficiency from a buzzword into a real competitive advantage. You'll see how top organizations use data from claims AI reviews to guide their automation strategies far more effectively.
This data-driven approach helps you answer the tough questions, like:
Where are my best people wasting time on low-value, repetitive tasks?
Which steps in our claims process are most prone to errors, and what's causing them?
How can we actually measure the impact of AI on first-contact resolution in our service centers?
Crafting a Modern Measurement Framework From the Ground Up
You can't improve what you don't measure. But in financial services, the challenge isn't a lack of data; it's the noise. Building a modern measurement framework is about cutting through that noise to see your operations clearly, connecting every action to a tangible business outcome. This isn't just about tracking numbers—it's about creating a living blueprint for efficiency.
The first move is always to map your most critical workflows. For an insurer, the entire claims journey, from First Notice of Loss (FNOL) to settlement, is prime territory. In banking, the spotlight might be on the Know Your Customer (KYC) and client onboarding processes. By breaking these sprawling journeys into distinct stages, you can pinpoint exactly where value is created and, more importantly, where friction and delays creep in.
This chart shows the evolution from simply monitoring operations to using an AI-driven system that actively finds and fixes bottlenecks.
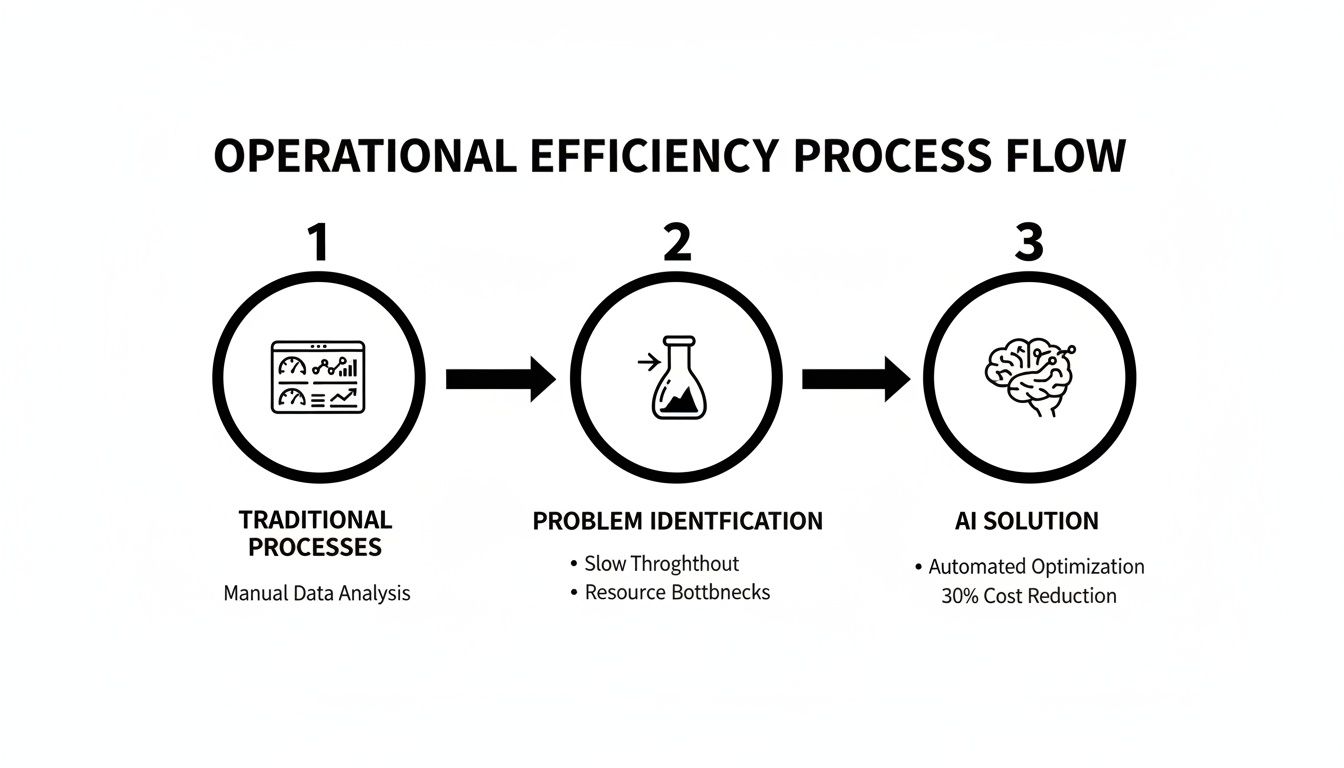
As you can see, the real advantage of modern systems is their ability to diagnose issues and automate the fix, creating a powerful loop of continuous improvement.
Selecting KPIs That Actually Matter
With your processes mapped, it's time to choose the Key Performance Indicators (KPIs) that will serve as your guideposts. You need metrics that send a clear, unambiguous signal about performance, not just vanity metrics that look good on a slide. Generic KPIs won't cut it; they must be tailored to the specific operational realities of your business.
Here are a few foundational KPIs that provide real insight:
End-to-End Cycle Time: This is the ultimate customer experience metric. It measures the total time from the very beginning of a process (like a claim being filed) to its final resolution.
Cost-Per-Transaction: This goes far beyond surface-level expenses. A true cost-per-transaction includes everything—labor, system usage, third-party vendor fees—required to complete a single unit of work, like processing one loan application.
Automation Rate: In today's environment, this is non-negotiable. It measures the percentage of process steps or entire transactions handled without any human touch. It’s the most direct way to quantify the ROI of your automation efforts.
The most effective measurement frameworks don't just tell you what happened yesterday. They provide leading indicators to predict what will happen tomorrow. For instance, tracking "time-in-stage" for each part of a workflow can reveal a brewing bottleneck long before it blows up your overall cycle time.
Understanding how to properly map these workflows is the bedrock of this entire exercise. For a more detailed walkthrough, our guide on how to streamline business processes offers a practical starting point. Grounding your KPIs in operational reality is what makes them truly powerful.
The Big Shift: From Traditional Metrics to AI-Enhanced Insights
The real game-changer in measuring operational efficiency is seeing how AI-enhanced metrics blow traditional ones out of the water. Old-school KPIs give you a rearview mirror perspective—they tell you what already happened. AI-native platforms, on the other hand, deliver predictive and diagnostic insights that let you see around the corner.
This table highlights the difference between looking backward with traditional KPIs and looking forward with the granular, actionable data provided by AI.
Key Performance Indicators Traditional vs AI-Enhanced
Metric Category | Traditional KPI | AI-Enhanced KPI & Insight |
|---|---|---|
Speed & Throughput | Average Claim Handling Time | Decision Latency: Pinpoints the exact time an AI agent takes to analyze a claim and recommend an action, revealing micro-delays invisible to humans. |
Quality & Accuracy | Error Rate (Manual Audit) | Data Extraction Accuracy: Measures the percentage of information captured correctly from documents on the first pass, identifying issues with specific document types or formats. |
Automation & Efficiency | Percentage of Automated Tasks | Human Escalation Rate: Tracks how often the AI needs human help and why, allowing for targeted refinement of automation rules based on real-world exceptions. |
Customer Experience | Average Handle Time (AHT) | Intent Recognition Success Rate: Shows how often the AI correctly identifies a customer's need without clarification, directly measuring the quality of the interaction. |
What this table demonstrates is a move from passive reporting to active diagnostics. Instead of just knowing your claims processing is slow, you discover it’s because the system struggles with handwritten forms from a particular vendor. That’s an insight you can act on immediately.
By building your framework around these precise, AI-generated metrics, you create a system that doesn't just measure efficiency—it actively guides you toward improving it. This focused, data-rich approach ensures every investment you make is targeted, measurable, and directly tied to strengthening your core operations.
Connecting Your Data and Validating Your Metrics
Having a sharp set of KPIs is a great start, but those metrics are only as good as the data feeding them. This is where theory hits the pavement. You need to get your hands dirty and instrument the core systems where the work actually gets done, ensuring you can pull clean, trustworthy data.

This means going straight to the source. For AI insurance companies, we're talking about tapping directly into platforms like Guidewire or Duck Creek. If you're in financial services focusing on AI customer care, you’ll be instrumenting CRMs like Salesforce and contact center software like Genesys. The goal is to capture the raw ingredients of your metrics—timestamps, status changes, user actions—at every critical step of a workflow.
Establish an Unbreakable Data Trail
It's not enough to just pull the data; you have to be able to trace every single metric back to its origin. This is data lineage, and in regulated industries like banking and insurance, it's absolutely non-negotiable. Think of it as an auditable paper trail that proves your efficiency numbers are legitimate.
Without it, your metrics are just black boxes. When a "cost per claim" number suddenly spikes, clear lineage lets you follow the data trail back to the root cause. Was it a jump in adjuster time? A new third-party fee? Or just a simple data entry mistake? This traceability is what transforms a number into a story you can act on.
This is especially true when you’re assessing the performance of claims AI reviews. You must have an irrefutable link showing that the AI's efficiency gains are based on real, verifiable data from your core claims system.
Strong data lineage is your best defense against skepticism. When you can show any stakeholder the exact origin and transformation of every data point, your metrics become the source of truth that builds confidence and drives smart decisions.
The Make-or-Break Process of Metric Validation
Once the data is flowing, you have to validate it. Rigorously. This is much more than just running a report and hoping the numbers are right. Validation is an active, investigative process to confirm your metrics are a true reflection of reality.
You'll want to attack this from a few different angles:
Cross-System Reconciliation: Compare data from different systems that should tell the same story. For instance, does the number of closed tickets in Salesforce line up with the case resolutions logged in your core banking platform? They should.
Scenario Testing: Push a few test cases through the process and see if the metrics come out as expected. Process a simple, low-value insurance claim and then a complex, multi-party one. The captured cycle times and costs should be drastically different and make logical sense.
Manual Spot-Checks: This is the ground-truth test. Grab a random sample of 20 insurance claims or loan applications and calculate the KPIs by hand. Compare your manual results to the system's report. Any gaps will tell you where your logic or data might be off.
This validation work is what ensures your data isn't just present, but correct. For a more technical look at this, our guide on data validation techniques offers some more advanced strategies.
A Real-World Validation Example
Let’s say you’re validating a "Cost Per Claim" metric. A basic report might just pull salary data from HR and add some system-logged expenses. That’s a start, but it’s not enough.
A thorough validation process goes deeper:
Deconstruct the Metric: First, break it down. Does "labor cost" include the fully-loaded cost of an adjuster (benefits, overhead, etc.), or is it just their base salary? The difference can be significant.
Verify Time Logs: Are the hours logged against a claim actually accurate? Sit down with an adjuster and ask them about a specific claim. Does the time logged in the system match their memory of the effort involved?
Audit Third-Party Costs: Check the invoices from external vendors, like appraisers or legal reviewers. Are they being correctly attributed to the specific claims they relate to, or are they being dumped into a general overhead bucket?
This kind of granular, almost forensic, validation is the only way to be certain your measurements are sound. If you skip this, you risk making strategic decisions based on flawed data, which is a fast track to wasted time and missed opportunities.
From Measurement to Mastery: Using AI to Drive Efficiency
Once you have a solid, validated data foundation, you can shift from just measuring efficiency to actively driving it. This is where AI-native platforms completely change the game. They don't just automate tasks; they generate a firehose of granular data that makes your measurements incredibly precise and, more importantly, actionable. This creates a powerful feedback loop where automation and measurement feed each other, fueling continuous improvement.
Modern AI agents can track things like micro-latencies—tiny delays within a process that are completely invisible to human observers or traditional reports. Imagine an insurance claims adjuster taking three minutes to verify a policy detail. An AI agent might do it in three seconds. But the real insight comes when the agent's data reveals that two of those seconds were spent waiting for a legacy database to respond. That’s the kind of hidden inefficiency that, once fixed, unlocks huge performance gains.
Slashing Insurance Claim Cycle Times with Smarter Automation
Top-tier AI insurance companies are thinking beyond basic bots. They're deploying AI agents capable of managing complex workflows from beginning to end, which is a critical difference when it comes to measuring real operational efficiency.
Take the First Notice of Loss (FNOL) process, for example. A single AI agent can:
Instantly pull claim details from any source—an email, a web form, even a phone call transcript.
Use natural language processing to extract and structure the key information.
Ping the core system to confirm policy coverage.
Intelligently assign the claim to the right human adjuster based on their workload and the claim's complexity.
Every single one of these actions is timestamped with surgical precision. This allows you to measure the efficiency of the entire end-to-end process, not just a few isolated tasks.
This granular tracking is what makes claims AI reviews so much more powerful. You're not just seeing that cycle time improved by 15%. You're seeing that the decision latency in coverage verification dropped by a staggering 98%, and you know exactly how that contributed to the overall speed increase.
This level of detail gives operations leaders undeniable proof of their automation ROI and clearly points to the next best place to optimize. To get a better handle on the possibilities, it helps to understand the wider applications of AI in business operations, which really puts into perspective how these intelligent systems are reshaping entire industries.
Taking Customer Care to the Next Level in Financial Services
The same idea holds true for AI customer care in banking. Old-school contact center metrics like Average Handle Time (AHT) give you a very narrow picture. Sure, an agent might get a customer off the phone quickly, but if that same customer has to call back tomorrow, was that interaction truly efficient?
AI agents, on the other hand, provide a much richer dataset that links efficiency directly to quality. They can track metrics like:
Intent Recognition Rate: How often did the AI understand the customer's actual need on the first try?
First Contact Resolution (FCR): An AI can analyze a customer's entire interaction history to see if their issue was really solved or if they reached out again through a different channel.
Compliance Adherence: By analyzing 100% of interactions, not just a small sample, AI ensures agents stick to required scripts and disclosures—a critical efficiency metric in a heavily regulated field.
This comprehensive view helps banks shift from a reactive, cost-cutting approach to customer service to a proactive, value-driven one.
The Financial Payoff of AI-Powered Operations
At the end of the day, it's all about translating operational gains into tangible financial results. The precision of AI-driven measurement makes this connection crystal clear. For years, banks have been spending a fortune on technology without seeing the productivity gains to match—globally, it's about $600 billion a year.
This is where AI finally breaks the trend. By pinpointing and automating the right processes, AI has the potential to slash certain cost categories by up to 70% gross. Even after accounting for the investment, this could lead to a 15-20% net decrease in the aggregate cost base. You can get more details on this financial shift in McKinsey's Global Banking Annual Review.
By using AI for both measurement and automation, financial institutions can finally stop the cycle of investing in tech without seeing clear returns. The data generated by AI agents offers undeniable proof of what's working, giving leaders the hard evidence they need to build a compelling business case for further innovation and secure a real competitive edge.
Turning Data into Action with Smart Dashboards
You've got the raw numbers, your metrics are validated, and the data is clean. Now comes the critical part: turning that raw material into something that actually drives change. This is where well-designed dashboards come in. They are the bridge between measurement and mobilization, creating a single source of truth for everyone from a frontline loan officer to the Chief Operating Officer.

The best visualizations tell a story at a glance. They prioritize clarity over clutter. Think about it: a dashboard for an AI-powered insurance firm shouldn't just display a raw count of processed claims. A much more powerful approach is to visually compare the cycle time of AI-handled claims against those that needed a human touch. Suddenly, the value of your automation is impossible to ignore.
Building a Foundation for Strategic Governance
With trustworthy metrics clearly visualized, you can finally set meaningful goals. This is where you move from vague aspirations like "speed up claims" to concrete Service Level Agreements (SLAs) backed by real data. An achievable, specific goal might be to "reduce the average First Notice of Loss (FNOL) to settlement time for low-complexity auto claims to under 48 hours."
This kind of precision is only possible when you have complete faith in the underlying numbers. Setting SLAs on shaky data is a classic recipe for missed targets and frustrated teams. When your data is solid, those SLAs become genuine tools for accountability and high performance.
A dashboard's true purpose is to answer one question: "What should we do next?" If your charts don't point to a clear action—celebrating a win, investigating a bottleneck, or green-lighting an automation project—they aren't doing their job.
To get started, you don't always have to build from scratch. Specialized tools like call center reporting software can provide excellent blueprints for tracking key operational metrics. These platforms often come with templates and proven practices that can be adapted for financial services, helping you create impactful dashboards more quickly.
Driving a Rhythm of Continuous Improvement
Actionable dashboards aren't just for show; they are the centerpiece of a living, breathing cycle of continuous improvement. The key is to build a regular rhythm for review and feedback. This ensures the insights you uncover don't just sit on a screen—they actively fuel your next big operational leap.
This feedback loop is what separates the leaders from the laggards. For instance, the data you gather from AI-driven claims reviews should directly inform the priorities on your automation roadmap.
Weekly Huddles: Frontline managers can pull up the dashboard to review team performance, spot immediate issues (like a sudden spike in escalations from the AI customer care bot), and make quick, tactical adjustments.
Monthly Business Reviews: Department heads can zoom out to analyze trends. They might see that while overall claim processing times are down, a specific type of complex liability claim is lagging, signaling a need for better AI training or process tweaks.
Quarterly Strategic Sessions: Leadership can use high-level views to evaluate the ROI of major automation projects and make informed decisions on where to invest next.
This structured approach connects measurement directly to execution. The data from your dashboards on topics like AI in insurance claims becomes the hard evidence that justifies further investment, creating a powerful, self-reinforcing cycle of optimization. Your ability to measure efficiency stops being a simple reporting task and becomes a true competitive advantage.
Digging into Your Top Efficiency Questions
When I talk with leaders in banking and insurance about AI, the same handful of questions always surface. Everyone wants to know how to measure efficiency in this new world, but it often feels like trying to navigate without a map. Let's tackle the most common ones with some practical, field-tested answers.
We're an Insurance Carrier. Where Do We Even Start Measuring Claims Efficiency?
For carriers, the first step is always about getting a solid baseline. Don't try to boil the ocean. Instead, pick a single, high-impact process—like First Notice of Loss (FNOL) to settlement—and map out its key stages. Be honest about where the obvious bottlenecks and pain points are.
Next, choose just three to five core KPIs to start. I always recommend these three:
Claim cycle time: The total time from when a claim is opened to when it's closed.
Cost per claim: This should include everything from adjuster time to administrative overhead.
First Contact Resolution (FCR): A great indicator of customer satisfaction and internal friction.
Before you even think about new tools, pull this data from your existing systems, whether that’s Guidewire or Duck Creek. This initial data set, however imperfect, is your stake in the ground. It’s what you'll use to build the business case for AI and, more importantly, prove its value down the line.
How Does AI Customer Care Actually Change How We Measure Efficiency in Banking?
The real game-changer with AI customer care is the incredible level of detail it provides. Old-school metrics like "average handle time" are blunt instruments. An AI agent, on the other hand, can track incredibly specific micro-metrics for every single interaction—things like "intent recognition time," "data retrieval latency," or "compliance check duration."
This precision lets you pinpoint the exact source of a delay. Instead of knowing a call was long, you know why it was long. Beyond speed, AI can also automate quality assurance by analyzing 100% of customer interactions for sentiment and compliance scripts. This is a massive leap from the old model of manual spot-checks, giving you a complete, real-time picture of both quality and risk.
By shifting from sample-based quality checks to comprehensive analysis, banks can transform their risk management posture. This isn't just an efficiency gain; it's a fundamental improvement in operational control and compliance.
Our Error Rates Are High. How Can Better Measurement Fix That?
High error rates are rarely just about "human error." They're usually a symptom of a confusing process, system friction, or inadequate training. Better measurement helps by shining a light on exactly where things are breaking down. When you instrument each step of a workflow—data entry, policy validation, payment authorization—you can see precisely which stage is generating the most mistakes.
An AI-native platform can take this a step further by finding patterns you’d never spot on your own. For example, it might reveal that 70% of errors happen when agents are handling one specific type of complex claim or when they have to access a particular legacy system. As often highlighted in claims AI reviews, this kind of data-driven insight allows you to attack the root cause, whether that means rewriting a procedure, redesigning a workflow, or simply automating that one problematic step.
What's the Real Difference Between Standard Automation and AI Agents?
This is a critical distinction that often gets missed. Think of traditional automation like Robotic Process Automation (RPA) as a digital assembly line worker. It's fantastic at doing simple, repetitive tasks inside a single application by following a very rigid script.
An AI agent is more like an experienced team member. It can read and understand complex Standard Operating Procedures (SOPs), reason through multi-step processes that span different systems (like moving from Salesforce to a core banking platform), and make context-based decisions to get the job done.
For measurement, this means you graduate from tracking "task-level" efficiency to "process-level" efficiency. Instead of measuring how fast a bot clicks a button, you're measuring the end-to-end cycle time for an entire mortgage application or insurance claim. That’s a far more meaningful and accurate view of your real operational performance.
Ready to move from measuring to mastering your operations? The Nolana platform deploys compliant AI agents to automate high-stakes workflows in banking and insurance, giving you the granular data and end-to-end execution needed to drive real efficiency. Discover how Nolana can transform your operations.
Measuring operational efficiency isn't just about shaving a few points off your expense ratio. It's a much deeper dive into how your core resources—your people, your tech stack, and your time—actually create value for the business and your customers.
This means you have to get granular. You need precise KPIs for the workflows that matter most, whether that's processing insurance claims or handling customer service inquiries in a bank. The goal is to use hard data to find the real bottlenecks and then fix them. For a detailed guide on implementation, exploring how to improve operational efficiency provides a foundational next step.
Rethinking Operational Efficiency in the AI Era
Let's be honest. Staring at dashboards full of stale, traditional metrics just won't cut it anymore. If you're a leader in banking or insurance, you're feeling the pressure from fintech disruptors and sky-high customer expectations. The old ways of measuring operational efficiency are simply not equipped to handle the complexity of modern, digitally-driven workflows.
This is especially true as AI starts to reshape everything.
With the rise of AI customer care and automated claims processing, we need a complete rethink. It’s no longer enough to just track things like average handling time or the number of claims pushed through in a day. Those numbers don't tell you the whole story. They can't explain why a complex claim has been sitting in a queue for a week or pinpoint the exact interaction that’s causing a customer to get frustrated.
The Shift from Cost-Cutting to Value Creation
The conversation has moved on. We're shifting away from a narrow-minded focus on cost reduction toward a much broader view of value creation. This means connecting operational improvements directly to things that really move the needle: customer satisfaction, employee morale, and your competitive standing in the market.
For AI insurance companies, this shift is non-negotiable. They aren't just using technology to do the same old things a bit faster; they're fundamentally changing the service they deliver. A big part of this modern approach involves a smarter strategy for managing technology spend, which makes understanding cloud cost optimization a critical piece of the puzzle.
The real goal of measuring efficiency isn’t just to find savings. It's to pinpoint the exact opportunities where intelligent automation can eliminate friction, boost accuracy, and create a better experience for both your customers and your team.
This guide will walk you through a practical framework designed for this new reality. We’ll look at how modern measurement helps you identify the specific bottlenecks where AI can deliver the biggest wins, turning efficiency from a buzzword into a real competitive advantage. You'll see how top organizations use data from claims AI reviews to guide their automation strategies far more effectively.
This data-driven approach helps you answer the tough questions, like:
Where are my best people wasting time on low-value, repetitive tasks?
Which steps in our claims process are most prone to errors, and what's causing them?
How can we actually measure the impact of AI on first-contact resolution in our service centers?
Crafting a Modern Measurement Framework From the Ground Up
You can't improve what you don't measure. But in financial services, the challenge isn't a lack of data; it's the noise. Building a modern measurement framework is about cutting through that noise to see your operations clearly, connecting every action to a tangible business outcome. This isn't just about tracking numbers—it's about creating a living blueprint for efficiency.
The first move is always to map your most critical workflows. For an insurer, the entire claims journey, from First Notice of Loss (FNOL) to settlement, is prime territory. In banking, the spotlight might be on the Know Your Customer (KYC) and client onboarding processes. By breaking these sprawling journeys into distinct stages, you can pinpoint exactly where value is created and, more importantly, where friction and delays creep in.
This chart shows the evolution from simply monitoring operations to using an AI-driven system that actively finds and fixes bottlenecks.
As you can see, the real advantage of modern systems is their ability to diagnose issues and automate the fix, creating a powerful loop of continuous improvement.
Selecting KPIs That Actually Matter
With your processes mapped, it's time to choose the Key Performance Indicators (KPIs) that will serve as your guideposts. You need metrics that send a clear, unambiguous signal about performance, not just vanity metrics that look good on a slide. Generic KPIs won't cut it; they must be tailored to the specific operational realities of your business.
Here are a few foundational KPIs that provide real insight:
End-to-End Cycle Time: This is the ultimate customer experience metric. It measures the total time from the very beginning of a process (like a claim being filed) to its final resolution.
Cost-Per-Transaction: This goes far beyond surface-level expenses. A true cost-per-transaction includes everything—labor, system usage, third-party vendor fees—required to complete a single unit of work, like processing one loan application.
Automation Rate: In today's environment, this is non-negotiable. It measures the percentage of process steps or entire transactions handled without any human touch. It’s the most direct way to quantify the ROI of your automation efforts.
The most effective measurement frameworks don't just tell you what happened yesterday. They provide leading indicators to predict what will happen tomorrow. For instance, tracking "time-in-stage" for each part of a workflow can reveal a brewing bottleneck long before it blows up your overall cycle time.
Understanding how to properly map these workflows is the bedrock of this entire exercise. For a more detailed walkthrough, our guide on how to streamline business processes offers a practical starting point. Grounding your KPIs in operational reality is what makes them truly powerful.
The Big Shift: From Traditional Metrics to AI-Enhanced Insights
The real game-changer in measuring operational efficiency is seeing how AI-enhanced metrics blow traditional ones out of the water. Old-school KPIs give you a rearview mirror perspective—they tell you what already happened. AI-native platforms, on the other hand, deliver predictive and diagnostic insights that let you see around the corner.
This table highlights the difference between looking backward with traditional KPIs and looking forward with the granular, actionable data provided by AI.
Key Performance Indicators Traditional vs AI-Enhanced
Metric Category | Traditional KPI | AI-Enhanced KPI & Insight |
|---|---|---|
Speed & Throughput | Average Claim Handling Time | Decision Latency: Pinpoints the exact time an AI agent takes to analyze a claim and recommend an action, revealing micro-delays invisible to humans. |
Quality & Accuracy | Error Rate (Manual Audit) | Data Extraction Accuracy: Measures the percentage of information captured correctly from documents on the first pass, identifying issues with specific document types or formats. |
Automation & Efficiency | Percentage of Automated Tasks | Human Escalation Rate: Tracks how often the AI needs human help and why, allowing for targeted refinement of automation rules based on real-world exceptions. |
Customer Experience | Average Handle Time (AHT) | Intent Recognition Success Rate: Shows how often the AI correctly identifies a customer's need without clarification, directly measuring the quality of the interaction. |
What this table demonstrates is a move from passive reporting to active diagnostics. Instead of just knowing your claims processing is slow, you discover it’s because the system struggles with handwritten forms from a particular vendor. That’s an insight you can act on immediately.
By building your framework around these precise, AI-generated metrics, you create a system that doesn't just measure efficiency—it actively guides you toward improving it. This focused, data-rich approach ensures every investment you make is targeted, measurable, and directly tied to strengthening your core operations.
Connecting Your Data and Validating Your Metrics
Having a sharp set of KPIs is a great start, but those metrics are only as good as the data feeding them. This is where theory hits the pavement. You need to get your hands dirty and instrument the core systems where the work actually gets done, ensuring you can pull clean, trustworthy data.
This means going straight to the source. For AI insurance companies, we're talking about tapping directly into platforms like Guidewire or Duck Creek. If you're in financial services focusing on AI customer care, you’ll be instrumenting CRMs like Salesforce and contact center software like Genesys. The goal is to capture the raw ingredients of your metrics—timestamps, status changes, user actions—at every critical step of a workflow.
Establish an Unbreakable Data Trail
It's not enough to just pull the data; you have to be able to trace every single metric back to its origin. This is data lineage, and in regulated industries like banking and insurance, it's absolutely non-negotiable. Think of it as an auditable paper trail that proves your efficiency numbers are legitimate.
Without it, your metrics are just black boxes. When a "cost per claim" number suddenly spikes, clear lineage lets you follow the data trail back to the root cause. Was it a jump in adjuster time? A new third-party fee? Or just a simple data entry mistake? This traceability is what transforms a number into a story you can act on.
This is especially true when you’re assessing the performance of claims AI reviews. You must have an irrefutable link showing that the AI's efficiency gains are based on real, verifiable data from your core claims system.
Strong data lineage is your best defense against skepticism. When you can show any stakeholder the exact origin and transformation of every data point, your metrics become the source of truth that builds confidence and drives smart decisions.
The Make-or-Break Process of Metric Validation
Once the data is flowing, you have to validate it. Rigorously. This is much more than just running a report and hoping the numbers are right. Validation is an active, investigative process to confirm your metrics are a true reflection of reality.
You'll want to attack this from a few different angles:
Cross-System Reconciliation: Compare data from different systems that should tell the same story. For instance, does the number of closed tickets in Salesforce line up with the case resolutions logged in your core banking platform? They should.
Scenario Testing: Push a few test cases through the process and see if the metrics come out as expected. Process a simple, low-value insurance claim and then a complex, multi-party one. The captured cycle times and costs should be drastically different and make logical sense.
Manual Spot-Checks: This is the ground-truth test. Grab a random sample of 20 insurance claims or loan applications and calculate the KPIs by hand. Compare your manual results to the system's report. Any gaps will tell you where your logic or data might be off.
This validation work is what ensures your data isn't just present, but correct. For a more technical look at this, our guide on data validation techniques offers some more advanced strategies.
A Real-World Validation Example
Let’s say you’re validating a "Cost Per Claim" metric. A basic report might just pull salary data from HR and add some system-logged expenses. That’s a start, but it’s not enough.
A thorough validation process goes deeper:
Deconstruct the Metric: First, break it down. Does "labor cost" include the fully-loaded cost of an adjuster (benefits, overhead, etc.), or is it just their base salary? The difference can be significant.
Verify Time Logs: Are the hours logged against a claim actually accurate? Sit down with an adjuster and ask them about a specific claim. Does the time logged in the system match their memory of the effort involved?
Audit Third-Party Costs: Check the invoices from external vendors, like appraisers or legal reviewers. Are they being correctly attributed to the specific claims they relate to, or are they being dumped into a general overhead bucket?
This kind of granular, almost forensic, validation is the only way to be certain your measurements are sound. If you skip this, you risk making strategic decisions based on flawed data, which is a fast track to wasted time and missed opportunities.
From Measurement to Mastery: Using AI to Drive Efficiency
Once you have a solid, validated data foundation, you can shift from just measuring efficiency to actively driving it. This is where AI-native platforms completely change the game. They don't just automate tasks; they generate a firehose of granular data that makes your measurements incredibly precise and, more importantly, actionable. This creates a powerful feedback loop where automation and measurement feed each other, fueling continuous improvement.
Modern AI agents can track things like micro-latencies—tiny delays within a process that are completely invisible to human observers or traditional reports. Imagine an insurance claims adjuster taking three minutes to verify a policy detail. An AI agent might do it in three seconds. But the real insight comes when the agent's data reveals that two of those seconds were spent waiting for a legacy database to respond. That’s the kind of hidden inefficiency that, once fixed, unlocks huge performance gains.
Slashing Insurance Claim Cycle Times with Smarter Automation
Top-tier AI insurance companies are thinking beyond basic bots. They're deploying AI agents capable of managing complex workflows from beginning to end, which is a critical difference when it comes to measuring real operational efficiency.
Take the First Notice of Loss (FNOL) process, for example. A single AI agent can:
Instantly pull claim details from any source—an email, a web form, even a phone call transcript.
Use natural language processing to extract and structure the key information.
Ping the core system to confirm policy coverage.
Intelligently assign the claim to the right human adjuster based on their workload and the claim's complexity.
Every single one of these actions is timestamped with surgical precision. This allows you to measure the efficiency of the entire end-to-end process, not just a few isolated tasks.
This granular tracking is what makes claims AI reviews so much more powerful. You're not just seeing that cycle time improved by 15%. You're seeing that the decision latency in coverage verification dropped by a staggering 98%, and you know exactly how that contributed to the overall speed increase.
This level of detail gives operations leaders undeniable proof of their automation ROI and clearly points to the next best place to optimize. To get a better handle on the possibilities, it helps to understand the wider applications of AI in business operations, which really puts into perspective how these intelligent systems are reshaping entire industries.
Taking Customer Care to the Next Level in Financial Services
The same idea holds true for AI customer care in banking. Old-school contact center metrics like Average Handle Time (AHT) give you a very narrow picture. Sure, an agent might get a customer off the phone quickly, but if that same customer has to call back tomorrow, was that interaction truly efficient?
AI agents, on the other hand, provide a much richer dataset that links efficiency directly to quality. They can track metrics like:
Intent Recognition Rate: How often did the AI understand the customer's actual need on the first try?
First Contact Resolution (FCR): An AI can analyze a customer's entire interaction history to see if their issue was really solved or if they reached out again through a different channel.
Compliance Adherence: By analyzing 100% of interactions, not just a small sample, AI ensures agents stick to required scripts and disclosures—a critical efficiency metric in a heavily regulated field.
This comprehensive view helps banks shift from a reactive, cost-cutting approach to customer service to a proactive, value-driven one.
The Financial Payoff of AI-Powered Operations
At the end of the day, it's all about translating operational gains into tangible financial results. The precision of AI-driven measurement makes this connection crystal clear. For years, banks have been spending a fortune on technology without seeing the productivity gains to match—globally, it's about $600 billion a year.
This is where AI finally breaks the trend. By pinpointing and automating the right processes, AI has the potential to slash certain cost categories by up to 70% gross. Even after accounting for the investment, this could lead to a 15-20% net decrease in the aggregate cost base. You can get more details on this financial shift in McKinsey's Global Banking Annual Review.
By using AI for both measurement and automation, financial institutions can finally stop the cycle of investing in tech without seeing clear returns. The data generated by AI agents offers undeniable proof of what's working, giving leaders the hard evidence they need to build a compelling business case for further innovation and secure a real competitive edge.
Turning Data into Action with Smart Dashboards
You've got the raw numbers, your metrics are validated, and the data is clean. Now comes the critical part: turning that raw material into something that actually drives change. This is where well-designed dashboards come in. They are the bridge between measurement and mobilization, creating a single source of truth for everyone from a frontline loan officer to the Chief Operating Officer.
The best visualizations tell a story at a glance. They prioritize clarity over clutter. Think about it: a dashboard for an AI-powered insurance firm shouldn't just display a raw count of processed claims. A much more powerful approach is to visually compare the cycle time of AI-handled claims against those that needed a human touch. Suddenly, the value of your automation is impossible to ignore.
Building a Foundation for Strategic Governance
With trustworthy metrics clearly visualized, you can finally set meaningful goals. This is where you move from vague aspirations like "speed up claims" to concrete Service Level Agreements (SLAs) backed by real data. An achievable, specific goal might be to "reduce the average First Notice of Loss (FNOL) to settlement time for low-complexity auto claims to under 48 hours."
This kind of precision is only possible when you have complete faith in the underlying numbers. Setting SLAs on shaky data is a classic recipe for missed targets and frustrated teams. When your data is solid, those SLAs become genuine tools for accountability and high performance.
A dashboard's true purpose is to answer one question: "What should we do next?" If your charts don't point to a clear action—celebrating a win, investigating a bottleneck, or green-lighting an automation project—they aren't doing their job.
To get started, you don't always have to build from scratch. Specialized tools like call center reporting software can provide excellent blueprints for tracking key operational metrics. These platforms often come with templates and proven practices that can be adapted for financial services, helping you create impactful dashboards more quickly.
Driving a Rhythm of Continuous Improvement
Actionable dashboards aren't just for show; they are the centerpiece of a living, breathing cycle of continuous improvement. The key is to build a regular rhythm for review and feedback. This ensures the insights you uncover don't just sit on a screen—they actively fuel your next big operational leap.
This feedback loop is what separates the leaders from the laggards. For instance, the data you gather from AI-driven claims reviews should directly inform the priorities on your automation roadmap.
Weekly Huddles: Frontline managers can pull up the dashboard to review team performance, spot immediate issues (like a sudden spike in escalations from the AI customer care bot), and make quick, tactical adjustments.
Monthly Business Reviews: Department heads can zoom out to analyze trends. They might see that while overall claim processing times are down, a specific type of complex liability claim is lagging, signaling a need for better AI training or process tweaks.
Quarterly Strategic Sessions: Leadership can use high-level views to evaluate the ROI of major automation projects and make informed decisions on where to invest next.
This structured approach connects measurement directly to execution. The data from your dashboards on topics like AI in insurance claims becomes the hard evidence that justifies further investment, creating a powerful, self-reinforcing cycle of optimization. Your ability to measure efficiency stops being a simple reporting task and becomes a true competitive advantage.
Digging into Your Top Efficiency Questions
When I talk with leaders in banking and insurance about AI, the same handful of questions always surface. Everyone wants to know how to measure efficiency in this new world, but it often feels like trying to navigate without a map. Let's tackle the most common ones with some practical, field-tested answers.
We're an Insurance Carrier. Where Do We Even Start Measuring Claims Efficiency?
For carriers, the first step is always about getting a solid baseline. Don't try to boil the ocean. Instead, pick a single, high-impact process—like First Notice of Loss (FNOL) to settlement—and map out its key stages. Be honest about where the obvious bottlenecks and pain points are.
Next, choose just three to five core KPIs to start. I always recommend these three:
Claim cycle time: The total time from when a claim is opened to when it's closed.
Cost per claim: This should include everything from adjuster time to administrative overhead.
First Contact Resolution (FCR): A great indicator of customer satisfaction and internal friction.
Before you even think about new tools, pull this data from your existing systems, whether that’s Guidewire or Duck Creek. This initial data set, however imperfect, is your stake in the ground. It’s what you'll use to build the business case for AI and, more importantly, prove its value down the line.
How Does AI Customer Care Actually Change How We Measure Efficiency in Banking?
The real game-changer with AI customer care is the incredible level of detail it provides. Old-school metrics like "average handle time" are blunt instruments. An AI agent, on the other hand, can track incredibly specific micro-metrics for every single interaction—things like "intent recognition time," "data retrieval latency," or "compliance check duration."
This precision lets you pinpoint the exact source of a delay. Instead of knowing a call was long, you know why it was long. Beyond speed, AI can also automate quality assurance by analyzing 100% of customer interactions for sentiment and compliance scripts. This is a massive leap from the old model of manual spot-checks, giving you a complete, real-time picture of both quality and risk.
By shifting from sample-based quality checks to comprehensive analysis, banks can transform their risk management posture. This isn't just an efficiency gain; it's a fundamental improvement in operational control and compliance.
Our Error Rates Are High. How Can Better Measurement Fix That?
High error rates are rarely just about "human error." They're usually a symptom of a confusing process, system friction, or inadequate training. Better measurement helps by shining a light on exactly where things are breaking down. When you instrument each step of a workflow—data entry, policy validation, payment authorization—you can see precisely which stage is generating the most mistakes.
An AI-native platform can take this a step further by finding patterns you’d never spot on your own. For example, it might reveal that 70% of errors happen when agents are handling one specific type of complex claim or when they have to access a particular legacy system. As often highlighted in claims AI reviews, this kind of data-driven insight allows you to attack the root cause, whether that means rewriting a procedure, redesigning a workflow, or simply automating that one problematic step.
What's the Real Difference Between Standard Automation and AI Agents?
This is a critical distinction that often gets missed. Think of traditional automation like Robotic Process Automation (RPA) as a digital assembly line worker. It's fantastic at doing simple, repetitive tasks inside a single application by following a very rigid script.
An AI agent is more like an experienced team member. It can read and understand complex Standard Operating Procedures (SOPs), reason through multi-step processes that span different systems (like moving from Salesforce to a core banking platform), and make context-based decisions to get the job done.
For measurement, this means you graduate from tracking "task-level" efficiency to "process-level" efficiency. Instead of measuring how fast a bot clicks a button, you're measuring the end-to-end cycle time for an entire mortgage application or insurance claim. That’s a far more meaningful and accurate view of your real operational performance.
Ready to move from measuring to mastering your operations? The Nolana platform deploys compliant AI agents to automate high-stakes workflows in banking and insurance, giving you the granular data and end-to-end execution needed to drive real efficiency. Discover how Nolana can transform your operations.
Want early access?
© 2026 Nolana Limited. All rights reserved.
Leroy House, Unit G01, 436 Essex Rd, London N1 3QP
Want early access?
© 2026 Nolana Limited. All rights reserved.
Leroy House, Unit G01, 436 Essex Rd, London N1 3QP
Want early access?
© 2026 Nolana Limited. All rights reserved.
Leroy House, Unit G01, 436 Essex Rd, London N1 3QP
Want early access?
© 2026 Nolana Limited. All rights reserved.
Leroy House, Unit G01, 436 Essex Rd, London N1 3QP