Data Analytics in Insurance Industry: Maximize ROI 2026
Data Analytics in Insurance Industry: Maximize ROI 2026
Discover how data analytics in insurance industry transforms pricing, claims, fraud, and customer retention. Explore key use cases & ROI for 2026.

A claims team can have the right people, the right rules, and still feel behind every morning. Files stack up in inboxes, brokers chase updates, handlers keep switching between systems, and the customer on the other end only sees delay. That gap between available data and actual workflow execution is where data analytics in the insurance industry becomes operationally important, not just technically interesting.
For a COO or Chief Claims Officer, the pressure is familiar. Leaders are asked to improve service, reduce leakage, tighten governance, and do it without forcing a disruptive platform replacement. The practical answer is not another dashboard sitting beside the work, but analytics that sits inside the work, guides decisions, and helps handlers move faster with better context. That's where the industry is heading, because the data footprint has expanded far beyond policy records into claims files, telematics, weather data, credit bureaus, social media activity, IoT feeds, and third-party databases, making analytics a core operating layer rather than a reporting add-on. The shift in insurance data capability is already reshaping how insurers price, triage, settle, and govern claims.
The New Reality for Insurance Operations
A large claims book rarely fails because people don't care. It fails because the work is fragmented. A handler opens a file, checks coverage in one system, reviews notes in another, waits on a document by email, and then rekeys information into the core platform. By the time the file gets attention again, the customer has already called twice.
That's the day-to-day reality many operations leaders are trying to fix. The old model, where teams relied on manual review and static reports, can't keep pace with expectations for faster decisions and cleaner audit trails. Analytics changes the operating rhythm, because it can surface what needs attention, route files intelligently, and give handlers the next best action before the bottleneck becomes visible.
Practical rule: if analytics doesn't alter a handler's action inside the workflow, it's still a report, not an operational capability.
This is why transformation programs in insurance now look more like workflow redesign than pure data projects. McKinsey's insurance work frames the move as an enterprise capability shift, from identifying use cases and assessing data assets to piloting and scaling new data-led business models, and that logic maps directly to claims operations. The same thinking applies to digital operating models in adjacent regulated sectors as well, which is why a useful reference point for leaders is this overview of financial services digital transformation. The core lesson is simple, if the process stays manual, the value stays partial.
In that environment, analytics is not a nice-to-have. It becomes the bridge between scattered data and the kind of decisions that reduce cycle time, improve service quality, and keep experienced handlers focused on judgment calls instead of administration.
What Data Analytics in Insurance Really Means
Data analytics in insurance used to mean historical reporting, usually generated after the fact and reviewed in a meeting no one wanted to sit through. That model still has a place, but it's no longer enough. Today, analytics is a core business capability that supports descriptive, predictive, and prescriptive decisions across underwriting, claims, fraud, and customer management, which is why the industry's conversation has shifted from BI output to operational action. McKinsey's insurance analytics perspective treats this as an operating-model issue, not just a tooling choice.
Then vs now
Traditional BI asks what happened last quarter. Modern analytics asks what's likely to happen next, and what action should follow. That difference matters in claims, where yesterday's reporting can't stop today's backlog.
Descriptive analytics tells teams what happened. A claims leader might use it to review file volumes, average handling patterns, or the mix of simple and complex losses.
Predictive analytics estimates what could happen. In practice, that can mean forecasting severity, prioritizing risky claims, or identifying which files are likely to stall.
Prescriptive analytics recommends what should happen next. For a handler, that may be the next best action, the right queue, or whether a file should be escalated.
The International Association of Insurance Supervisors also notes that big data analytics can let insurers cluster customers into increasingly refined risk categories for different treatment in underwriting, pricing, marketing, and claims settlement, which is one reason analytics matters so much inside claims workflows. The IAIS issues paper is especially useful here because it frames analytics as supervisory guidance, not vendor marketing.
A useful cross-industry comparison comes from data-driven decisions for car dealers, where the operational goal is the same, turn data into immediate action for the person doing the work. Insurance leaders can borrow that mindset without copying the exact tooling. If a model doesn't help a person decide faster, it isn't delivering enough value.
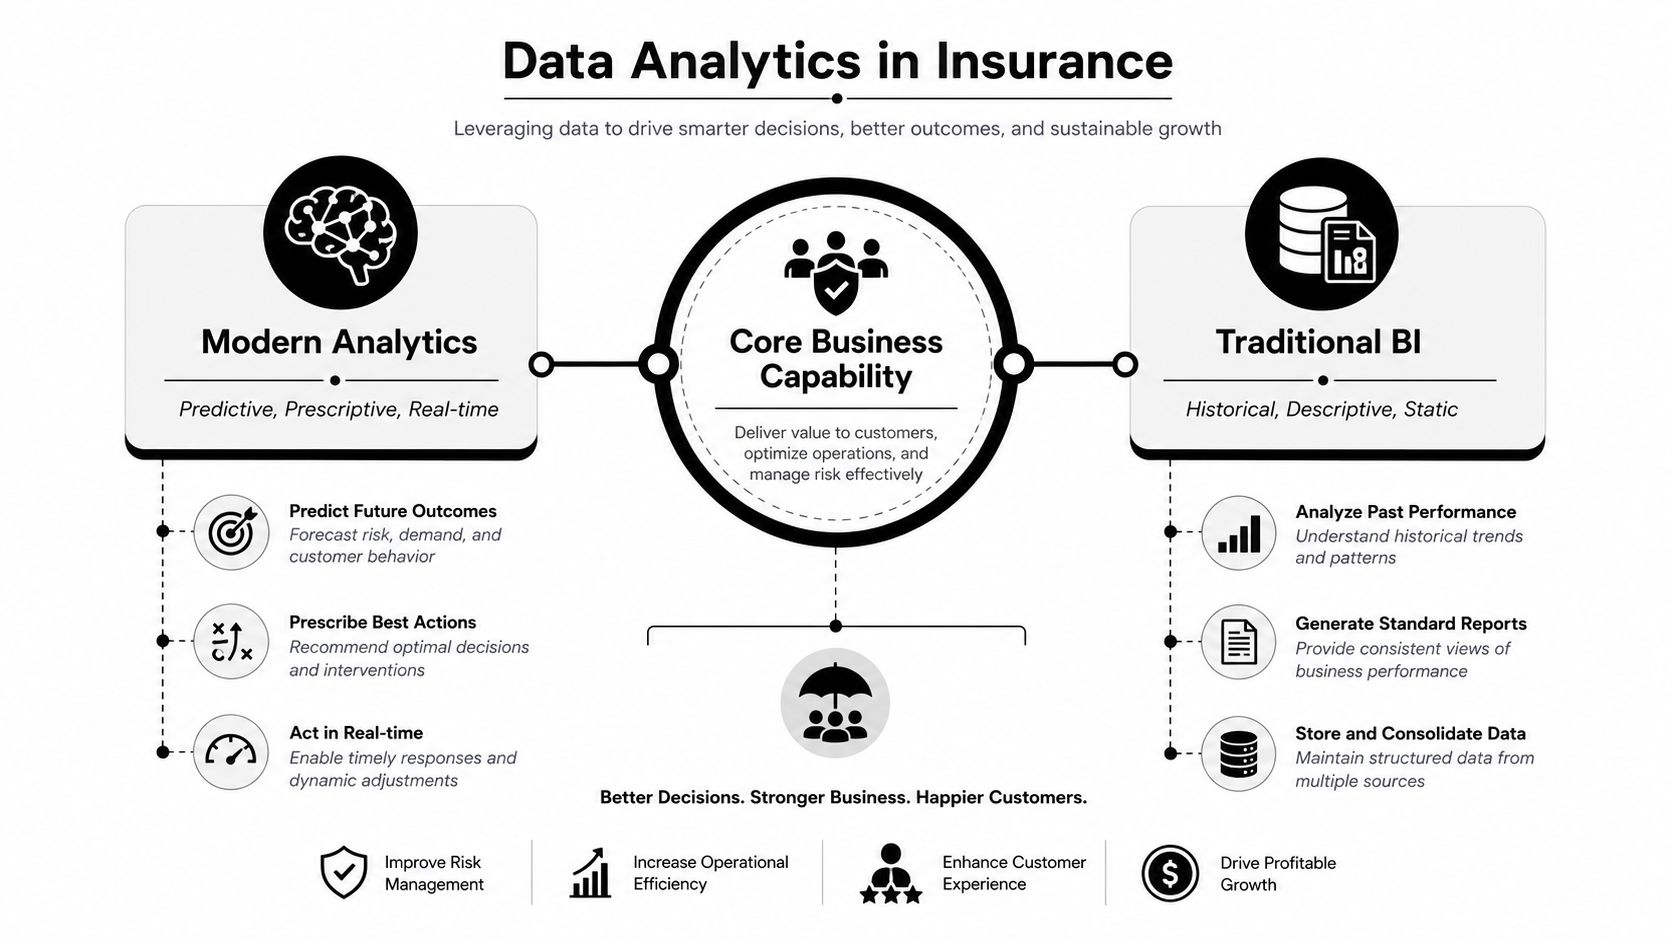
The most important takeaway is that analytics is no longer just about visibility. It's about decision support embedded in the operating process, with governance and human judgment built in.
For teams that struggle with underlying data fragmentation, the starting point is often improving data quality before adding more models. Bad inputs don't become good outputs because the dashboard looks polished.
Key Use Cases Transforming the Insurance Value Chain
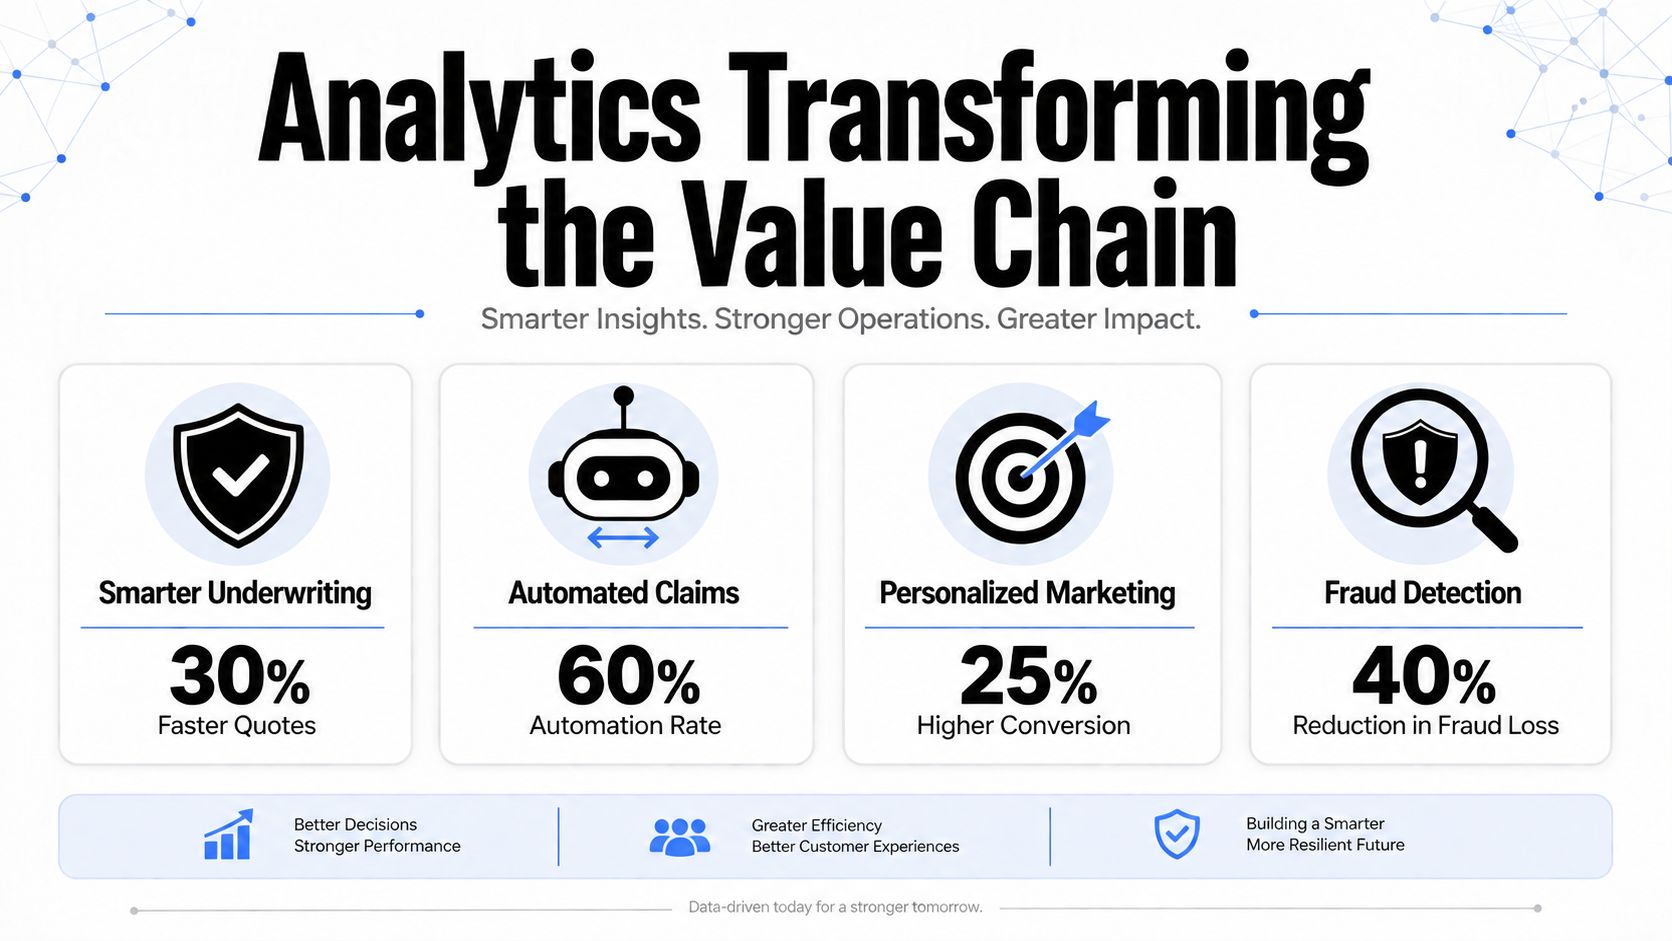
A claims team waiting on manual checks, a broker chasing the same missing document twice, or an underwriter rekeying data from three systems all point to the same problem. The highest-return analytics use cases change those daily decisions. Underwriting, claims, fraud, and customer experience all benefit, but the mechanics differ, and that is where many programs miss the mark. Teams often buy a broad platform, then find the pain sits in a small set of workflow choke points.
Smarter underwriting and pricing
Underwriting is where insurers turn broad data into risk selection. In Capgemini's insurance executive survey, insurance leaders said they are using data to develop new solutions, create value-added services, and generate sharper insight into risk assessment and pricing. That is the point: data investments should shape operational decisions, not sit in a reporting layer.
The value here is consistency. Predictive models can help underwriters handle high-volume cases faster, while human review stays in place for edge cases and exceptions. That matters because the underwriter's job is not only pricing, it is also judgment, exception handling, and compliance. Good analytics supports those decisions without forcing the team to trust every case in the same way.
Claims processing that actually moves
Claims is where analytics becomes visible to the business. Nationwide's outlook on insurance analytics says traditional fraud rules miss too much, and it points to $308.6 billion a year in estimated fraud costs to businesses and consumers, which is why predictive modeling, link analysis, and AI are increasingly used to flag suspicious claims before payout. Nationwide's outlook on insurance analytics also notes that regulators are watching insurer AI decisions more closely because they affect coverage, pricing, and claim evaluation.
That changes the design brief. Claims analytics has to be explainable, auditable, and embedded where handlers already work. A claims platform should remove administrative drag, not push it into another portal. For a deeper look at how AI handles FNOL intake and document processing, see our guide on AI insurance claims processing.
Analytics in claims works best when it helps handlers decide, not when it replaces the handler's judgment.
For a claims team, that means automated document handling, priority scoring, dormant-file management, and workflow coordination. It also means better handoffs between brokers, cover holders, and internal teams, which is often where delay builds up. The practical test is simple, if the handler still has to chase basic facts across systems, the analytics layer is not doing enough.
Fraud detection and earlier intervention
Fraud analytics has one of the clearest business cases because the economic impact is concrete. The same Nationwide source shows why rule-based approaches miss too much, and why link analysis and AI are gaining ground. Operationally, earlier detection means investigators spend less time on obvious false positives and more time on the files that deserve scrutiny. That improves queue quality and helps reduce unnecessary handoffs.
Customer experience that reduces churn
Personalization is often treated as a marketing topic, but it shows up in claims too. Faster status updates, cleaner communication, and fewer repeated requests for the same information all affect retention. Fleetalyse's work on driver behavior data is a useful reminder that behavioral data can support operational decisions when it is applied carefully. In insurance, the same principle applies, the more relevant the action, the less friction the customer feels, and the easier it is to optimise fleet driver efficiency where that data is part of the service model.
A strong claims program usually starts with one narrow workflow, then expands only after the team trusts the output. That is safer than trying to automate every process at once, because claims operations need control points for exceptions, auditability, and human review.
The Anatomy of an Insurance Analytics Engine
Think of an analytics program like a high-performance engine. Data is the fuel, architecture is the engine block, models are the components, and governance is the maintenance schedule that keeps everything from seizing up.
The fuel comes from more places than it used to. Internal policy systems, claims systems, billing, contact center notes, and document repositories still matter, but insurers now also use IoT sensors, telematics, credit bureaus, weather feeds, social data, and third-party databases. Those sources matter because they expand the evidence available for routing, severity prediction, and fraud detection, which is why analytics is now tied to the wider operating model rather than a single department.
Data architecture matters more than model hype
A warehouse alone won't solve the problem if the business needs near-real-time decisioning. A data lake alone won't help if no one can trust the definitions or trace the lineage. Most insurers need both patterns, with the warehouse supporting curated, governed reporting and the lake supporting broader ingestion and experimentation.
That architecture choice affects claims directly. If a file needs current weather data, telematics context, or a third-party validation check, the platform has to absorb and route data without forcing every team into manual workarounds. That's why streaming and real-time processing matter so much for operational workflows.
Techniques that turn data into action
Machine learning helps rank risk and flag anomalies. AI helps process unstructured documents, extract fields, and summarize communication threads. Real-time streaming supports immediate triggers, such as an escalation, a priority queue move, or an alert that a file has gone dormant.
The most useful systems don't try to replace every human decision. They handle repetitive classification and surface the exceptions that need judgment.
Machine learning is useful when the pattern is subtle, such as severity scoring or claim clustering.
AI document processing is useful when the work is buried in PDFs, emails, and notes.
Streaming analytics is useful when delay itself creates cost, such as in triage or fraud response.
That technical stack only works if the organization agrees on definitions, ownership, and intervention points. Without that, the engine has parts, but no torque.
For leaders building the backend, the strongest goal isn't sophistication for its own sake. It's creating a system that can feed the workflow with trusted data and act fast enough to matter. Real-time data processing discipline becomes relevant the moment claims teams need immediate triggers instead of nightly summaries.
A Practical Roadmap for Implementing Analytics
Analytics programs fail when they're treated as software purchases. They succeed when they're treated as operating changes with clear ownership, workflow design, and governance. The first question isn't which model to buy, it's which business problem deserves a pilot and who will use the result inside the current process.
A practical roadmap starts with business goals. If the aim is reducing claims cycle time, the analytics scope should focus on file routing, inactivity detection, document capture, and escalation logic. If the aim is better risk selection, the work shifts toward enrichment, scoring, and exception handling. The point is to align data work with a measurable operational outcome, not an abstract transformation theme.
The sequence that tends to work
Define business goals. Pick one outcome, such as faster FNOL, less manual rekeying, or better triage.
Assess data readiness. Review source quality, data ownership, missing fields, and integration points.
Select a pilot project. Start with a workflow that has enough volume to matter, but enough structure to learn from.
Build the team. Include business owners, claims operations, IT, and analytics together.
Measure and scale. Expand only after users trust the output and the governance model holds up.
Important: the pilot should sit inside the claims system the handlers already use. Requiring people to leave their normal workflow for a separate analytics portal usually slows adoption.
That's where integration strategy becomes decisive. McKinsey's insurance research emphasizes agile cross-functional teams and end-to-end workflows, which is a good operating model for claims as well. In practice, the strongest implementations sit on top of existing claims and policy systems instead of replacing them, because adoption improves when handlers stay in familiar tools.
A useful implementation choice is to separate decision support from decision authority. Analytics can recommend a next step, route a file, or flag an exception, while a handler or manager keeps final control. That balance preserves governance and helps regulators understand how decisions are made. It also reduces the resistance that often appears when teams think automation is trying to replace their judgment.
Nolana fits naturally as one approach to workflow-level execution. It operates on top of existing claims and policy systems, supports managing agents, brokers, and cover holders, and keeps full human oversight and auditability in place. In operational terms, that means the organization can automate repetitive claims tasks without asking everyone to learn a new core platform on day one.
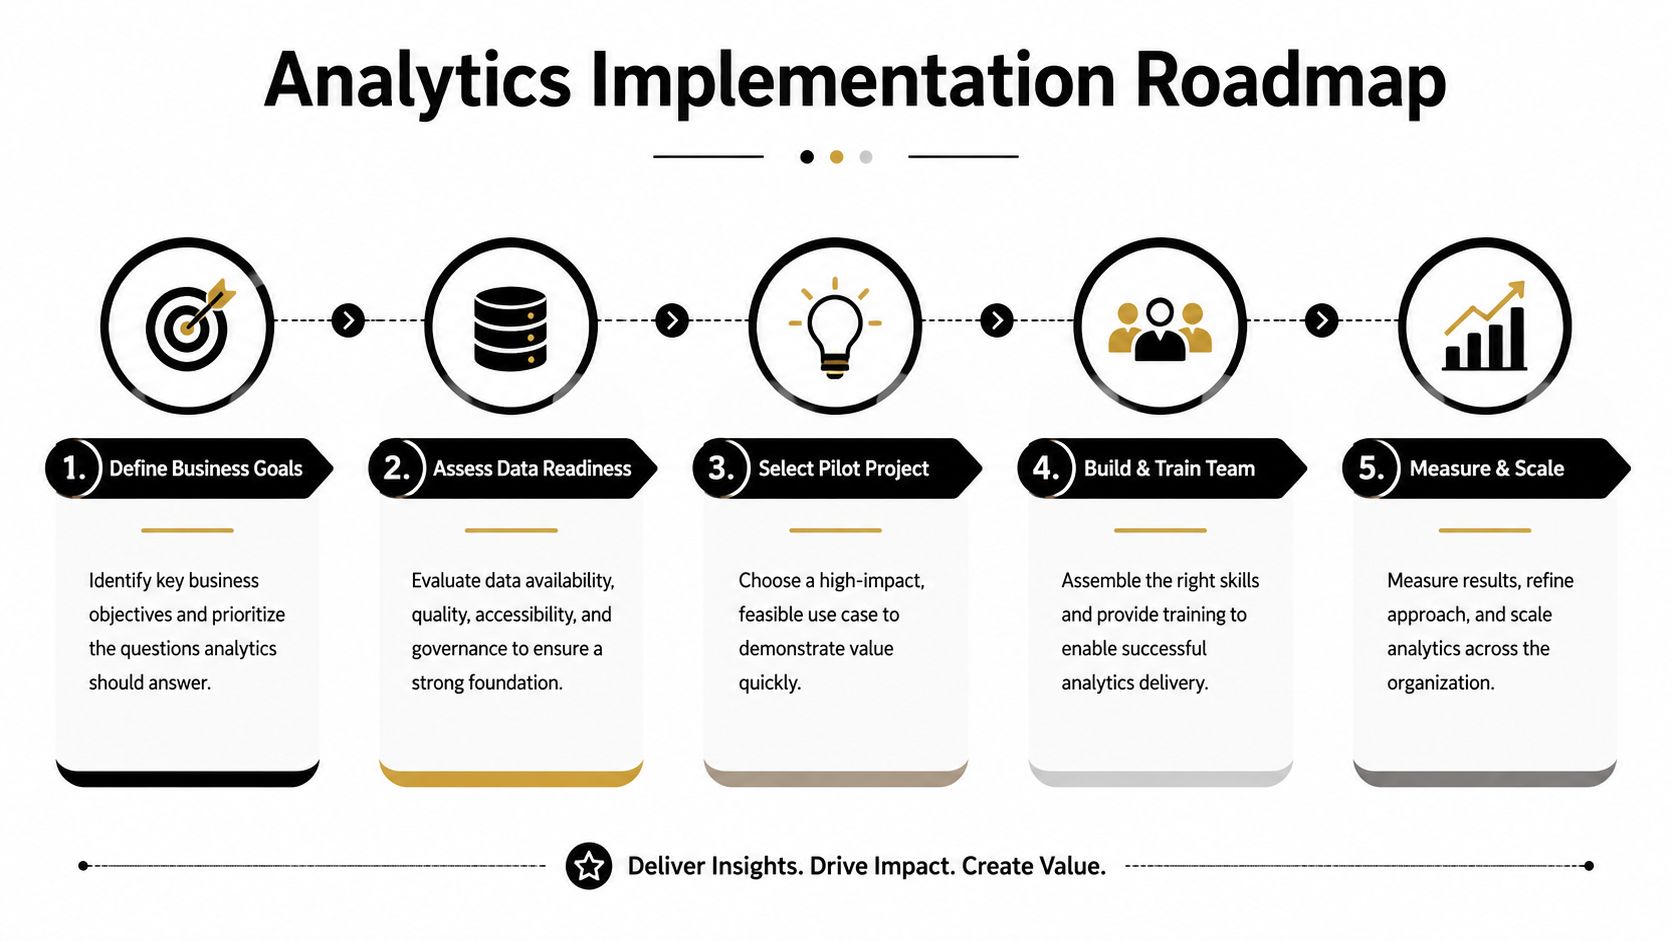
A roadmap only works if governance travels with it. If a model can't be explained, monitored, and amended when the process changes, scaling it just multiplies the risk.
Measuring Success and Proving ROI
Executives don't fund analytics because it looks modern. They fund it when it changes measurable business outcomes. That means the scorecard needs to move beyond activity metrics, such as model usage or dashboard views, and focus on the numbers the C-suite already cares about.
For claims operations, the most relevant measures are cycle time, handler throughput, backlog, loss impact, and customer experience. If analytics is helping route the right files to the right people, it should show up in faster resolution and less manual work. If it's helping spot suspicious claims earlier, it should reduce wasted effort and protect indemnity spend.
Link the use case to the metric
A pilot on FNOL intake should be measured against how much manual capture it removes and how quickly files become actionable. A triage model should be measured against how often it routes files correctly and how much rework it avoids. A dormant-file workflow should be judged by whether handlers spend less time searching for the next action and more time closing the file.
The value case gets stronger when those operational gains connect to enterprise metrics. Faster claims handling supports customer satisfaction. Better triage supports expense control. Better fraud detection supports loss ratio protection. None of that works if the analytics layer sits outside the workflow.
Track what matters, not what's easy
Claims cycle time: measure from first notice of loss to the next key action, then to settlement where relevant.
Handler throughput: track how many meaningful files a handler can progress with the same level of oversight.
Loss ratio impact: look for fewer avoidable payments, better fraud response, and cleaner routing decisions.
Customer satisfaction: monitor whether status updates, responsiveness, and resolution speed improve together.
The business case also needs to be realistic about what causes value. Some gains come from automation, some from better prioritization, and some from governance that reduces mistakes. Those gains are easier to defend when the workflow is visible and the intervention points are clear.
For a concrete reference point, Nolana's site describes outcomes such as up to 50× faster cycle times, up to 30% higher handler throughput, and up to 5% lower loss ratio, depending on context. Those figures should be treated as outcome ranges, not promises, but they show the scale of improvement a workflow-embedded claims platform can target.
The right metric design makes ROI easier to defend because it connects operations to the balance sheet. That's the conversation leadership wants, not a pile of adoption charts. A practical efficiency measurement framework helps teams tie process gains to business results without hiding behind vanity metrics.

If the ROI story depends on a single perfect model, it's too fragile. If it depends on a better workflow, better triage, and better governance, it can survive real-world complexity.
Your Next Steps in Data-Driven Insurance
The strongest insurance analytics programs don't start with a massive platform refresh. They start with one operational bottleneck, one team, and one measurable outcome. That's the most reliable way to prove value without overwhelming the organization.
Three actions are worth taking now. First, pick a claims workflow that consumes too much handler time, especially FNOL intake, triage, or dormant-file follow-up. Second, map the data sources that touch that workflow and identify where rekeying, delay, or ambiguity shows up. Third, define the governance rules before the pilot starts, so the team knows who can approve, override, and audit the model's recommendations.
The bigger lesson is that data analytics in the insurance industry is no longer about reporting what happened after the fact. It's about shaping how work moves through the organization, with controls strong enough for regulators and practical enough for the people doing the job.
If you lead claims, operations, or transformation, start with the process that frustrates your best handlers the most. If you want a platform that automates FNOL intake, document processing, triage, and static claims management while keeping human oversight and auditability in place, explore Nolana AI and see how its claims workflow automation fits into your existing operating model.
A claims team can have the right people, the right rules, and still feel behind every morning. Files stack up in inboxes, brokers chase updates, handlers keep switching between systems, and the customer on the other end only sees delay. That gap between available data and actual workflow execution is where data analytics in the insurance industry becomes operationally important, not just technically interesting.
For a COO or Chief Claims Officer, the pressure is familiar. Leaders are asked to improve service, reduce leakage, tighten governance, and do it without forcing a disruptive platform replacement. The practical answer is not another dashboard sitting beside the work, but analytics that sits inside the work, guides decisions, and helps handlers move faster with better context. That's where the industry is heading, because the data footprint has expanded far beyond policy records into claims files, telematics, weather data, credit bureaus, social media activity, IoT feeds, and third-party databases, making analytics a core operating layer rather than a reporting add-on. The shift in insurance data capability is already reshaping how insurers price, triage, settle, and govern claims.
The New Reality for Insurance Operations
A large claims book rarely fails because people don't care. It fails because the work is fragmented. A handler opens a file, checks coverage in one system, reviews notes in another, waits on a document by email, and then rekeys information into the core platform. By the time the file gets attention again, the customer has already called twice.
That's the day-to-day reality many operations leaders are trying to fix. The old model, where teams relied on manual review and static reports, can't keep pace with expectations for faster decisions and cleaner audit trails. Analytics changes the operating rhythm, because it can surface what needs attention, route files intelligently, and give handlers the next best action before the bottleneck becomes visible.
Practical rule: if analytics doesn't alter a handler's action inside the workflow, it's still a report, not an operational capability.
This is why transformation programs in insurance now look more like workflow redesign than pure data projects. McKinsey's insurance work frames the move as an enterprise capability shift, from identifying use cases and assessing data assets to piloting and scaling new data-led business models, and that logic maps directly to claims operations. The same thinking applies to digital operating models in adjacent regulated sectors as well, which is why a useful reference point for leaders is this overview of financial services digital transformation. The core lesson is simple, if the process stays manual, the value stays partial.
In that environment, analytics is not a nice-to-have. It becomes the bridge between scattered data and the kind of decisions that reduce cycle time, improve service quality, and keep experienced handlers focused on judgment calls instead of administration.
What Data Analytics in Insurance Really Means
Data analytics in insurance used to mean historical reporting, usually generated after the fact and reviewed in a meeting no one wanted to sit through. That model still has a place, but it's no longer enough. Today, analytics is a core business capability that supports descriptive, predictive, and prescriptive decisions across underwriting, claims, fraud, and customer management, which is why the industry's conversation has shifted from BI output to operational action. McKinsey's insurance analytics perspective treats this as an operating-model issue, not just a tooling choice.
Then vs now
Traditional BI asks what happened last quarter. Modern analytics asks what's likely to happen next, and what action should follow. That difference matters in claims, where yesterday's reporting can't stop today's backlog.
Descriptive analytics tells teams what happened. A claims leader might use it to review file volumes, average handling patterns, or the mix of simple and complex losses.
Predictive analytics estimates what could happen. In practice, that can mean forecasting severity, prioritizing risky claims, or identifying which files are likely to stall.
Prescriptive analytics recommends what should happen next. For a handler, that may be the next best action, the right queue, or whether a file should be escalated.
The International Association of Insurance Supervisors also notes that big data analytics can let insurers cluster customers into increasingly refined risk categories for different treatment in underwriting, pricing, marketing, and claims settlement, which is one reason analytics matters so much inside claims workflows. The IAIS issues paper is especially useful here because it frames analytics as supervisory guidance, not vendor marketing.
A useful cross-industry comparison comes from data-driven decisions for car dealers, where the operational goal is the same, turn data into immediate action for the person doing the work. Insurance leaders can borrow that mindset without copying the exact tooling. If a model doesn't help a person decide faster, it isn't delivering enough value.
The most important takeaway is that analytics is no longer just about visibility. It's about decision support embedded in the operating process, with governance and human judgment built in.
For teams that struggle with underlying data fragmentation, the starting point is often improving data quality before adding more models. Bad inputs don't become good outputs because the dashboard looks polished.
Key Use Cases Transforming the Insurance Value Chain
A claims team waiting on manual checks, a broker chasing the same missing document twice, or an underwriter rekeying data from three systems all point to the same problem. The highest-return analytics use cases change those daily decisions. Underwriting, claims, fraud, and customer experience all benefit, but the mechanics differ, and that is where many programs miss the mark. Teams often buy a broad platform, then find the pain sits in a small set of workflow choke points.
Smarter underwriting and pricing
Underwriting is where insurers turn broad data into risk selection. In Capgemini's insurance executive survey, insurance leaders said they are using data to develop new solutions, create value-added services, and generate sharper insight into risk assessment and pricing. That is the point: data investments should shape operational decisions, not sit in a reporting layer.
The value here is consistency. Predictive models can help underwriters handle high-volume cases faster, while human review stays in place for edge cases and exceptions. That matters because the underwriter's job is not only pricing, it is also judgment, exception handling, and compliance. Good analytics supports those decisions without forcing the team to trust every case in the same way.
Claims processing that actually moves
Claims is where analytics becomes visible to the business. Nationwide's outlook on insurance analytics says traditional fraud rules miss too much, and it points to $308.6 billion a year in estimated fraud costs to businesses and consumers, which is why predictive modeling, link analysis, and AI are increasingly used to flag suspicious claims before payout. Nationwide's outlook on insurance analytics also notes that regulators are watching insurer AI decisions more closely because they affect coverage, pricing, and claim evaluation.
That changes the design brief. Claims analytics has to be explainable, auditable, and embedded where handlers already work. A claims platform should remove administrative drag, not push it into another portal. For a deeper look at how AI handles FNOL intake and document processing, see our guide on AI insurance claims processing.
Analytics in claims works best when it helps handlers decide, not when it replaces the handler's judgment.
For a claims team, that means automated document handling, priority scoring, dormant-file management, and workflow coordination. It also means better handoffs between brokers, cover holders, and internal teams, which is often where delay builds up. The practical test is simple, if the handler still has to chase basic facts across systems, the analytics layer is not doing enough.
Fraud detection and earlier intervention
Fraud analytics has one of the clearest business cases because the economic impact is concrete. The same Nationwide source shows why rule-based approaches miss too much, and why link analysis and AI are gaining ground. Operationally, earlier detection means investigators spend less time on obvious false positives and more time on the files that deserve scrutiny. That improves queue quality and helps reduce unnecessary handoffs.
Customer experience that reduces churn
Personalization is often treated as a marketing topic, but it shows up in claims too. Faster status updates, cleaner communication, and fewer repeated requests for the same information all affect retention. Fleetalyse's work on driver behavior data is a useful reminder that behavioral data can support operational decisions when it is applied carefully. In insurance, the same principle applies, the more relevant the action, the less friction the customer feels, and the easier it is to optimise fleet driver efficiency where that data is part of the service model.
A strong claims program usually starts with one narrow workflow, then expands only after the team trusts the output. That is safer than trying to automate every process at once, because claims operations need control points for exceptions, auditability, and human review.
The Anatomy of an Insurance Analytics Engine
Think of an analytics program like a high-performance engine. Data is the fuel, architecture is the engine block, models are the components, and governance is the maintenance schedule that keeps everything from seizing up.
The fuel comes from more places than it used to. Internal policy systems, claims systems, billing, contact center notes, and document repositories still matter, but insurers now also use IoT sensors, telematics, credit bureaus, weather feeds, social data, and third-party databases. Those sources matter because they expand the evidence available for routing, severity prediction, and fraud detection, which is why analytics is now tied to the wider operating model rather than a single department.
Data architecture matters more than model hype
A warehouse alone won't solve the problem if the business needs near-real-time decisioning. A data lake alone won't help if no one can trust the definitions or trace the lineage. Most insurers need both patterns, with the warehouse supporting curated, governed reporting and the lake supporting broader ingestion and experimentation.
That architecture choice affects claims directly. If a file needs current weather data, telematics context, or a third-party validation check, the platform has to absorb and route data without forcing every team into manual workarounds. That's why streaming and real-time processing matter so much for operational workflows.
Techniques that turn data into action
Machine learning helps rank risk and flag anomalies. AI helps process unstructured documents, extract fields, and summarize communication threads. Real-time streaming supports immediate triggers, such as an escalation, a priority queue move, or an alert that a file has gone dormant.
The most useful systems don't try to replace every human decision. They handle repetitive classification and surface the exceptions that need judgment.
Machine learning is useful when the pattern is subtle, such as severity scoring or claim clustering.
AI document processing is useful when the work is buried in PDFs, emails, and notes.
Streaming analytics is useful when delay itself creates cost, such as in triage or fraud response.
That technical stack only works if the organization agrees on definitions, ownership, and intervention points. Without that, the engine has parts, but no torque.
For leaders building the backend, the strongest goal isn't sophistication for its own sake. It's creating a system that can feed the workflow with trusted data and act fast enough to matter. Real-time data processing discipline becomes relevant the moment claims teams need immediate triggers instead of nightly summaries.
A Practical Roadmap for Implementing Analytics
Analytics programs fail when they're treated as software purchases. They succeed when they're treated as operating changes with clear ownership, workflow design, and governance. The first question isn't which model to buy, it's which business problem deserves a pilot and who will use the result inside the current process.
A practical roadmap starts with business goals. If the aim is reducing claims cycle time, the analytics scope should focus on file routing, inactivity detection, document capture, and escalation logic. If the aim is better risk selection, the work shifts toward enrichment, scoring, and exception handling. The point is to align data work with a measurable operational outcome, not an abstract transformation theme.
The sequence that tends to work
Define business goals. Pick one outcome, such as faster FNOL, less manual rekeying, or better triage.
Assess data readiness. Review source quality, data ownership, missing fields, and integration points.
Select a pilot project. Start with a workflow that has enough volume to matter, but enough structure to learn from.
Build the team. Include business owners, claims operations, IT, and analytics together.
Measure and scale. Expand only after users trust the output and the governance model holds up.
Important: the pilot should sit inside the claims system the handlers already use. Requiring people to leave their normal workflow for a separate analytics portal usually slows adoption.
That's where integration strategy becomes decisive. McKinsey's insurance research emphasizes agile cross-functional teams and end-to-end workflows, which is a good operating model for claims as well. In practice, the strongest implementations sit on top of existing claims and policy systems instead of replacing them, because adoption improves when handlers stay in familiar tools.
A useful implementation choice is to separate decision support from decision authority. Analytics can recommend a next step, route a file, or flag an exception, while a handler or manager keeps final control. That balance preserves governance and helps regulators understand how decisions are made. It also reduces the resistance that often appears when teams think automation is trying to replace their judgment.
Nolana fits naturally as one approach to workflow-level execution. It operates on top of existing claims and policy systems, supports managing agents, brokers, and cover holders, and keeps full human oversight and auditability in place. In operational terms, that means the organization can automate repetitive claims tasks without asking everyone to learn a new core platform on day one.
A roadmap only works if governance travels with it. If a model can't be explained, monitored, and amended when the process changes, scaling it just multiplies the risk.
Measuring Success and Proving ROI
Executives don't fund analytics because it looks modern. They fund it when it changes measurable business outcomes. That means the scorecard needs to move beyond activity metrics, such as model usage or dashboard views, and focus on the numbers the C-suite already cares about.
For claims operations, the most relevant measures are cycle time, handler throughput, backlog, loss impact, and customer experience. If analytics is helping route the right files to the right people, it should show up in faster resolution and less manual work. If it's helping spot suspicious claims earlier, it should reduce wasted effort and protect indemnity spend.
Link the use case to the metric
A pilot on FNOL intake should be measured against how much manual capture it removes and how quickly files become actionable. A triage model should be measured against how often it routes files correctly and how much rework it avoids. A dormant-file workflow should be judged by whether handlers spend less time searching for the next action and more time closing the file.
The value case gets stronger when those operational gains connect to enterprise metrics. Faster claims handling supports customer satisfaction. Better triage supports expense control. Better fraud detection supports loss ratio protection. None of that works if the analytics layer sits outside the workflow.
Track what matters, not what's easy
Claims cycle time: measure from first notice of loss to the next key action, then to settlement where relevant.
Handler throughput: track how many meaningful files a handler can progress with the same level of oversight.
Loss ratio impact: look for fewer avoidable payments, better fraud response, and cleaner routing decisions.
Customer satisfaction: monitor whether status updates, responsiveness, and resolution speed improve together.
The business case also needs to be realistic about what causes value. Some gains come from automation, some from better prioritization, and some from governance that reduces mistakes. Those gains are easier to defend when the workflow is visible and the intervention points are clear.
For a concrete reference point, Nolana's site describes outcomes such as up to 50× faster cycle times, up to 30% higher handler throughput, and up to 5% lower loss ratio, depending on context. Those figures should be treated as outcome ranges, not promises, but they show the scale of improvement a workflow-embedded claims platform can target.
The right metric design makes ROI easier to defend because it connects operations to the balance sheet. That's the conversation leadership wants, not a pile of adoption charts. A practical efficiency measurement framework helps teams tie process gains to business results without hiding behind vanity metrics.
If the ROI story depends on a single perfect model, it's too fragile. If it depends on a better workflow, better triage, and better governance, it can survive real-world complexity.
Your Next Steps in Data-Driven Insurance
The strongest insurance analytics programs don't start with a massive platform refresh. They start with one operational bottleneck, one team, and one measurable outcome. That's the most reliable way to prove value without overwhelming the organization.
Three actions are worth taking now. First, pick a claims workflow that consumes too much handler time, especially FNOL intake, triage, or dormant-file follow-up. Second, map the data sources that touch that workflow and identify where rekeying, delay, or ambiguity shows up. Third, define the governance rules before the pilot starts, so the team knows who can approve, override, and audit the model's recommendations.
The bigger lesson is that data analytics in the insurance industry is no longer about reporting what happened after the fact. It's about shaping how work moves through the organization, with controls strong enough for regulators and practical enough for the people doing the job.
If you lead claims, operations, or transformation, start with the process that frustrates your best handlers the most. If you want a platform that automates FNOL intake, document processing, triage, and static claims management while keeping human oversight and auditability in place, explore Nolana AI and see how its claims workflow automation fits into your existing operating model.


All systems operational
Lloyd's Lab, One Lime Street, London EC3M 7HA
Copyright © 2026, Nolana. All rights reserved
All systems operational
Lloyd's Lab, One Lime Street, London EC3M 7HA
Copyright © 2026, Nolana. All rights reserved
All systems operational
Lloyd's Lab, One Lime Street, London EC3M 7HA
Copyright © 2026, Nolana. All rights reserved
All systems operational
Lloyd's Lab, One Lime Street, London EC3M 7HA
Copyright © 2026, Nolana. All rights reserved